

2. Nutrition
Malnutrition is a broad term that refers to both undernutrition and overnutrition. Undernutrition has 4 broad sub-forms namely: wasting, stunting, underweight, and micronutrient deficiencies. Overnutrition is characterized by being overweight and is often because of poor dietary habits and sedentary lifestyles. The three types of undernutrition that are specifically significant in emergencies situation are.
- Acute malnutrition is directly due to illness or inadequate consumption of food, or nutritional oedema.
- Chronic malnutrition is characterised by stunting (inhibited growth in height and cognitive development caused by poor nutrition over a period)
- Micronutrient deficiencies is due to sub-optimal intake of one or more essential micronutrient.
Acute Malnutrition
There are 2 sub-groups of acute malnutrition amongst children; Moderate Acute Malnutrition (MAM) which is defined as weight-for-height (WFH) of less than 2 standard deviations (SD) of the reference population median weight-for height or less than 125 cm Mid Upper Arm Circumference (MUAC). The other form of acute malnutrition is Severe Acute Malnutrition (SAM) which is defined as a weight-for-height of less than 3 standard deviations or less than 115cm MUAC, or bilateral pitting Oedema. Severe Acute Malnutrition (SAM) is further subdivided into 2 forms: Marasmus and Kwashiorkor. Marasmus is defined by the severe loss of body fat and muscle and Kwashiorkor by the presence of bilateral pitting oedema of both feet. Children who have kwashiorkor may not appear underweight initially because of their Oedema, hence Oedema is a separate criterion for admitting children with SAM into nutrition programs and is not measured by WFH or MUAC measurements but rather assessed through clinical signs as shown below. Therefore MUAC, weight-for-height, and bilateral oedema are all independent criteria for admission to treatment programmes, meaning that only one criterion needs to be met to be eligible for treatment. There is currently no consensus on how to identify pregnant women as acutely malnourished and when to enrol them in nutritional programmes. However according to the SPHERE Guidelines, MUAC may be used as tool to screen for malnutrition in pregnant and lactating women and as a criterion for entry into a feeding programme. The guidelines states that cut-off points for risk vary by country and range from 21 cm to 23 cm. For more information on anthropometric assessment see Annex 5.1.
| Types of Acute malnutrition | Clinical signs and anthropometric cut offs |
| Moderate acute Malnutrition in children | Moderately wasted, with WFH below 2 SD or MUAC of less than 125 mm. |
| Marasmus (Severe acute Malnutrition) in children | Extreme wasting, little fat or muscle, child’s skeleton clearly visible, lack of appetite in complicated cases with WFH less than 3 SD or MUAC of less than 115mm. |
| Kwashiorkor (Severe acute malnutrition) in Children | Bilateral Oedema of both feet; thin, sparse and pale hair that falls out easily, dry scaly skin especially on the arms and legs, a puffy or moon face and apathy. |
| Moderate Acute Malnutrition in pregnant and lactating women (PLW) | Moderately wasted, with MUAC of less than 210 mm or 230mm. |
Chronic Malnutrition
Chronic malnutrition is characterized by stunting (short stature for age) which is defined by inhibited growth in height and cognitive development. It is measured by low height-for-age of less than 2 standard deviations (SD) of the WHO reference population median height-for age. Stunting is the result of chronic or recurrent undernutrition due to poor socioeconomic conditions, poor maternal health and nutrition, frequent illness, and inappropriate infant and young child feeding and care in early life. It develops within the first 1,000 days of life (from conception to the age of two) and results in irreversible stunting of both cognitive and physical development. Thus, maternal nutritional status before and during pregnancy is very important and are determining factor of child nutrition.
Micronutrient Deficiencies
Micronutrients are vitamins and minerals needed by the body in very small amounts. Micronutrient deficiencies (MNDs), like all forms of undernutrition, occur due to insufficient intake and/or impaired absorption due to infection, disease, or inflammation. During emergencies, access to diverse foods is often a great challenge and a major cause of MNDs. Micronutrients of public health significance include iron, iodine, Vitamin A, Vitamin C, Zinc and folate as they cause widespread global micronutrient deficiencies especially in pregnant women and their children under 5 years who are the highest risk. MNDs are often referred to as hidden hunger and is often difficult to confirm clinically in emergency settings as biomarkers are not practical or feasible for widespread assessment outside of the clinical setting. Therefore, in the absence of diatary or biomarker data, we can only assume that countries with a high burden of undernutrition also have a high burden of MNDs[1].
Causes of Acute Malnutrition
The different causes of malnutrition are best explained by the UNICEF’s 1990 conceptual framework of malnutrition, which since then have been adapted several times (see Annex 5.2). The IPC acute malnutrition classification system also uses this analytical framework for analysis. Through this framework, we can analyse the different causes of malnutrition (which is the outcome or manifestation) by understanding the immediate, underlying, and basic causes of malnutrition. The immediate causes of malnutrition are inadequate dietary intake and disease. Inadequate dietary intake and diseases are caused by food insecurity, inadequate care for women and children, insufficient health services, and unsanitary environments. Therefore, it’s important to understand the food security situation, caring practices (including infant and young child feeding), access to maternal and child health services and WASH in an emergency when determining the likely impact on malnutrition. For example, open defecation and inappropriate hygiene and sanitation practices, especially during an emergency can increase the spread of infectious diseases such as acute water diarrhoea, scabies, measles, malaria etc. Infection increases the body’s requirements for nutrients, reduces appetite, and affects the absorption of nutrients from the gut, which leads to malnutrition. While infection can cause malnutrition, vice versa is also true as malnutrition can increase the risk of infection setting up a vicious cycle. A malnourished child, whose resistance to illness is poor, falls ill and becomes more malnourished, which reduces his capacity to fight against illness and so on.
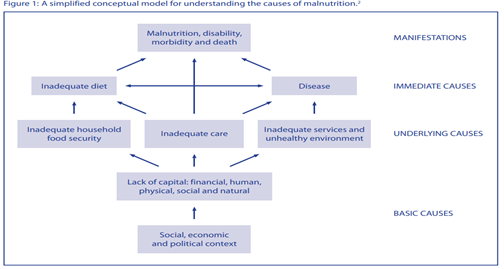
The basic causes of malnutrition include political, economic, legal, and ideological factors (including religion, culture, and tradition) which may prevent from attaining good nutrition. For example, these include the extent of which rights of women and girls are protected by law; the control they have over resources; the political and economic systems that determine how income and assets are distributed; and the policies that govern social sectors. The physical environment people live in can also play a role. For example, areas with frequent droughts, unreliable rainfall, flood prone, intense heat also impact on nutrition status. Political discrimination due to religion, race or clan can lead also to systematic marginalisation and exclusion from food and other available relief services and is one of the basic causes of malnutrition. In emergencies such groups may be too afraid to seek assistance or are ignored by the decision makers. In summary, the conceptual model highlights that malnutrition is not caused just by insufficient food intake. It demonstrates the complexity of connected factors that impact on nutrition at different levels hence any nutrition analysis must be take all these factors into account during an emergency.
What is a nutrition emergency?
Access to food and adequate nutritional status are critical determinants of people’s survival in a disaster. Malnutrition in its various forms often emerge during emergency situations, both natural and man-made ones when access to sufficient, nutritious food, health services, clean water and care and hygiene practices are compromised. In such situations there is an escalation of communicable diseases and most notably the big five diseases that are most severe amongst children under five years of age, i.e., measles; diarrhea; malaria; respiratory infections and malnutrition. During emergencies, even being mildly underweight is associated with increased mortality. WHO estimates that malnutrition is an underlying cause in almost half of all under-five child deaths[2]. The biggest killer in emergencies is child malnutrition that is either recorded as a direct or as an underlying cause of death. When classifying a nutrition emergency, it’s recommended to consider the overall trend in in global acute malnutrition (GAM) and Severe Acute Malnutrition (SAM), often a GAM of >15% or 10-14% with aggravating factors is considered to warrant an emergency nutrition response. However, it is important to not wait until a certain threshold has been reached before deciding to intervene as preventing malnutrition and its associated mortality is very important in an emergency. In addition, in certain contexts you need to consider additional risk factors such as prevailing high micronutrient deficiencies, childhood morbidity or doubling of GAM rates in short period of time even if in terms of absolute number, the prevalence is “low”, e.g., below 10%. In a nutrition emergency where the prevalence of acute malnutrition among young children might be 10% to 15% and of severe malnutrition, 2% to 3%, mortality rates can be very high. Elevated crude mortality and under-five mortality rates are also benchmarks for and definitions of a nutrition emergency. The Global Nutrition Cluster decision tool for emergencies for Moderate acute Malnutrition (Annex 5.3) can help you choose the most appropriate responses to address MAM in a particular emergency setting.
Who are most nutritionally vulnerable in emergencies?
Protecting the nutritional status of vulnerable groups affected by emergencies is important and a basic humanitarian right. The population groups most nutritionally vulnerable in emergencies can be categorised according to their:
- Physiological vulnerability (e.g., young children, pregnant and lactating women, older people, disabled, and people living with chronic illness such as HIV and AIDS)
- Geographical vulnerability (e.g., people living in drought- or flood-prone areas or in areas of conflict)
- Political vulnerability (e.g., oppressed populations)
- Internal displacement and refugee status (e.g., those who have fled with few resources and livelihoods)
Classifying Malnutrition
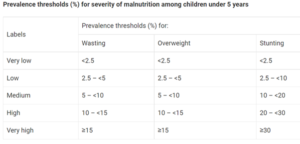
There are new prevalence thresholds for classifying the severity of different forms of malnutrition which has been established through the WHO-UNICEF Technical Advisory Group on Nutrition Monitoring (TEAM)[1]; it is recommended that these new thresholds will replace the current WHO ones that have been in place for a long time[2]. The thresholds were developed in relation to standard deviations (SD) of the normative WHO Child Growth Standards. The international definition of ‘normal’ (two SD from the WHO standards median) defines the first threshold, which includes 2.3% of the area under the normalized distribution. Multipliers of this “very low” level (rounded to 2.5%) set the basis to establish the subsequent thresholds. For more information kindly refer to Annex 5.1.
Nutrition Assessment
Nutrition assessment involves taking anthropometric measurements (measuring parts of the human body) and collecting information about an individual’s clinical and biochemical characteristics, dietary practices.
Why is nutrition assessment important?
- To identify people at risk of malnutrition for early intervention or referral before they become malnourished.
- To identify malnourished individuals for treatment
- To track child growth.
- To identify medical complications that affect the body’s ability to digest food and utilize nutrients
- To detect practices that can increase the risk of malnutrition and infection
- To inform nutrition education and counselling
- To establish appropriate nutrition care plans
Nutrition Assessments Methods
Nutritional assessment can be done using the ABCD methods:
- A. Anthropometry
- B. Biochemical/biophysical methods
- C. Clinical methods
- D. Dietary methods
The target population of nutrition surveys and interventions during emergencies are mostly children aged 6-59 months old, pregnant, and lactating women. However, there are also international standards for measuring malnutrition in adults, older children, adolescents, and the elderly. The most common emergency indicators collected during a nutrition survey are:
- Global Acute Malnutrition (GAM) – weight-for-height z-score <-2 and/or oedema,
- Severe Acute Malnutrition (SAM) – weight-for-height z-score <-3 and/or oedema,
- Oedema (bilateral Pitting oedema)
Mid upper arm Circumstances (MUAC) and Weight for Height (WHZ) are the anthropometric measurements taken to identify children most in need of treatment for acute malnutrition recommended by WHO. Bilateral pitting oedema is also a clinical method of diagnosing severe malnutrition on its own, regardless of the results of anthropometric assessment. MUAC is commonly used in the community to identify and refer children 6−59 months of age with acute malnutrition, it is also used to conduct mass screening as its easier to do within the community compared to taken weight and height of every child, in insecure areas with limited access and as a temporary programming adaptation to COVID-19 where Infection Protection Control (IPC) measures cannot be assured. However, MUAC, WHZ and Oedema can be used in health facilities to diagnose children with acute malnutrition and enroll them into treatment. In terms of program implementation WHO recommends using any of the three indicators to identify acute malnutrition, but one must use the same indicator for both diagnosis and discharging children out of treatment programs. Both MUAC and WHZ have their strengths and weaknesses and evidence suggest that MUAC is good at predicting the risk of death in children with SAM and selects younger children at highest risk while WHZ has tendency to select older children. Hence since both indicators choose different sub-groups of children and there is a great overlap between the two the GNC recommends the use of all the indicators for the assessment and treatment of acute malnutrition, including all children with low MUAC, low WHZ or bilateral pitting oedema – known as combined GAM (cGAM).
For Surveys Weight-for-height is used as the main indicator of malnutrition. It is robust, independent of age for children, has an internationally accepted reference population, and its interpretation is based on wide experience in many parts of the world. Boys and girls are treated separately; however, it is recommended that MUAC measurement be included in all anthropometric surveys and that the two criteria are not alternative measures of the loss of body tissue, but complementary to one another thus should both be used independently to guide admission for treatment of malnourished children[1].
Dietary assessments are conducted to understand the quality and quantity of the diets consumed and it’s often done using the following methods.
- 24-hour recall methods
- Food frequency questionnaire
- Food group questionnaire
This is useful especially when designing nutrition interventions aimed at improving dietary diversity, quantity and quality through social behavior change communication (SBCC) or cash for nutrition outcome.
Biochemical assessment is often not done during emergencies as it’s often not practical to check the levels of nutrients in a person’s blood, urine, or stools due to lack of lab facilities and tools needed. Also, this can only be done by medical professionals, but this method obviously can give more useful information about the medical problems that may affect appetite or nutritional status.
For further information on nutritional assessment using different methods please see Annex 5.4.
When should you conduct a Nutrition survey?
- To establish baseline data to determine if a nutrition emergency exists
- To estimate the severity and geographical spread of a nutrition emergency, including the groups most affected or at risk.
- To assess the likely impact of the emergency on health and nutrition because of primary drivers of malnutrition.
- To determine the need or expand existing nutrition interventions
- To determine the effectiveness of nutrition programs.
- To determine the need to establish or expand nutrition surveillance
What are the key factors to consider when planning a nutrition survey?
- Determine the relevance and timing of doing a survey
- Gather existing and contextual information from local partners and authorities
- Define survey objectives
- Define the geographic area and population group(s) to be surveyed
- Decide what additional information to collect.
Conducting a nutrition survey is expensive and time-consuming, therefore before starting an assessment you should ask the following questions:
- Are the needs of the affected population obvious? If yes, then implementation takes priority over a survey and hence can be deferred.
- Are the results critical for decision making?
- Has anyone else done a SMART survey in the areas recently? If yes use their data.
- Will it be possible to implement evidence-based recommendations? There is little point in doing a survey if it is already known that a response will not be possible
- Is the affected population accessible? Insecurity or geographical constraints may result in limited access to the population of interest. If this is extreme, a survey cannot be conducted.
Seasonal changes in malnutrition exists, for example in a context where seasonal cycles might have a serious effect on household’s food security, surveys should be conducted at periods of highest or lowest nutrition and food security risk, i.e., harvest time or hunger gap. Also, during the rainy season where the risk of water-borne diseases is higher the effect of seasonality might be observed in increases in admissions to feeding centers hence this is also indicative of seasonal effects.
Where can I find important manuals on how to design and analyze nutrition surveys?
To conduct a cross-sectional representative nutrition survey, you should always follow the SMART methodology which can be used for both a rapid and a full assessment. This will require a SMART manager’s training and certification, alternatively the country office can hire a SMART Survey consultant to do this. Below are the resources available on survey designs and methods.
- SMART (2017) Measuring Mortality, Nutritional Status, and Food Security in Crisis Situations: SMART Methodology. SMART Manual Version 2 published in 2017. Available for downloaded here
- CDC/WFP (2005) A Manual: Measuring and Interpreting Malnutrition and Mortality. Available here
- Duffield A, Taylor A (2004) Emergency Nutrition Assessment: Guidelines for Field Workers. Save the Children. Available here
How to do a Nutrition Situation Analysis?
A nutrition situation analysis helps you to define and categorize the severity of a given humanitarian situation across geographical areas based on the magnitude of the nutritional needs of the population. There is a list of core nutrition indicators and thresholds for acute malnutrition and its contributing factors that have been developed by the Global Nutrition Cluster (GNC) taskforce to streamline nutrition situation analysis. These indicators are aligned with the IPC AMN (acute malnutrition) analytic framework. This will provide you with a common approach for classifying the severity of malnutrition and identifying its key drivers in your country, it will also allow decision makers the ability to compare across context between one area or country to another. The core list of nutrition indicators and contributing factors with thresholds can be found in Annex 5.5. In a situation where the GAM in your country is above 5% and there is an IPC AMN analysis done at country level then you can use that data for your nutrition situation analysis, however you must ensure the validity period of the existing IPC AMN severity classification. If the situation has significantly changed, then there is a need to update the analysis in consultation with the IPC country taskforce and in consultation with your nutrition cluster.
[1] Grellety and Golden BMC Nutrition (2016) 2:10. Available online
Estimating Nutrition Program Caseload
In any nutrition response that includes management of acute malnutrition in children under 5 years, pregnant and lactating women (PLW), it is important to accurately estimate the number of children and PLWs to be targeted for treatment services. Without being able to do this right you risk either over or underestimating the target beneficiaries, which can have huge program implications, especially when it comes to estimating the supplies needed and resources. The total number of children under 5 and PLW needing treatment services during the project cycle can be achieved by either using a caseload calculator (see Annex 5.6) or you can do this manually. To calculate the total number of children or PLW with Acute Malnutrition (AM) to be targeted by the project, follow the steps below.
- The total burden of AM = existing cases + new cases
The existing cases are those currently malnourished and can be obtained by multiplying AM prevalence rate with the number of children aged 6 to 59 months in the population.AM prevalence x number of children under five in the populationsThe prevalence rate of acute malnutrition, also termed GAM, can be obtained from recent SMART surveys, if there is no SMART data then proxy GAM can be used from mass screening data. The proportion of children under 5 years, pregnant and lactating women (PLW) in the population can be obtained by census, demographic surveys, and SMART surveys. Once you know the proportion of children under 5 and PLW in the population, you multiply it with total population estimate data to obtain the number of children and PLW in that population.For example: if 20% of the population are children aged 6-59 months and the population size is 18,000 then the expected number of children aged 6-59 months is 3,600 (20% x 18,000)The New cases are those expected to be malnourished during the project, so this is looking at new incidences of malnutrition during the project period and those currently expected to be malnourished. To do this a general rule of thumb is to use what is called the incidence correction Factor (K). For short term emergency projects that last between 3-6 months, an incidence correction factor of 1.6 is generally used and for projects between 8-12 months K of 2.6 is used.However according to more recent studies on incidence of malnutrition and the actual burden of acute malnutrition, it is advised that a more contextualized incidence data should be used whenever possible in countries where incidence of malnutrition is known to accurately estimate the burden of acute malnutrition. Hence check with your local nutrition cluster team if you are unsure of what incidence rate is used in your country.Once you have decided on the incidence rate to use you can sufficiently estimate the total burden of acute malnutrition by using the formula below. - AM prevalence x number of children aged 6-59 months x KOnce you get the total cases of malnutrition in the area, then the final thing to decide on is the coverage. According to SPHERE standards, coverage in rural areas should be more than 50%, in urban areas more than 70% and in camp situations more than 90%.In Summary the formula for estimating nutrition caseloads or target for treatment programs are. The same formula can be applied to get target Caseload for PLWs and for MAM treatment program.
Formulae: P x N x K x C
P = Prevalence of acute malnutrition
N = Number of children or PLW in the affected population
K = Incidence correction Factor
C = Targeted program coverage
TIP 1: If SAM prevalence is not known, consider using on average an estimate of 20% of GAM to be suffering from SAM; and 10% of the SAM cases have medical complication and need impatient care.
Example Calculations
We want to estimate the total number of children aged 6 to 59 months suffering from Severe Acute Malnutrition (SAM) without medical complications who will be targeted and admitted in an OTP (Outpatient Therapeutic program). From the national census we know that the total number of children aged 6 to 59 months is 20% of the population. In X town there are 86,000 people, hence, the total number of children under 5 living in this town is 17,200. SAM prevalence is 1.8% according to a recent SMART survey in that area. The program is planned in rural areas, so we agreed to apply a coverage of 50%.
Total target of SAM children aged 6- 59 months will be = 17,200 x 1.8% x 2.6 x 50% = 402
We agreed that on average 90% of the SAM cases detected will be admitted in OTPs and 10% admitted in Stabilization center (SC) therefore this project will target 90% of 402 (361) for the OTP services.
[1] Bailey R.L., West Jr. K.P., Black R.E. The Epidemiology of Global Micronutrient Deficiencies. Ann Nutr Metab 2015;66(suppl 2):22-33.
[2] https://www.who.int/news-room/fact-sheets/detail/malnutrition, accessed 11th April 2022.
[3] WHO. UNICEF New Prevalence Thresholds for Stunting, Wasting and Overweight in Children. [(accessed on 22 March 2021)]; 2018 Available online
[4] De Onis, M., et al. (2018). Prevalence thresholds for wasting, overweight and stunting in children under 5 years. Public health nutrition, 22(1), 175–179.
Malnutrition affects all countries regardless of the nature of the malnutrition problem and income levels. WHO estimates that globally 1 out of 3 people is affected by one form of malnutrition and almost half of all child deaths among children under 5 years of age are linked to undernutrition, making it a global public health problem. Many developing countries are currently affected by the double burden of malnutrition (undernutrition and overnutrition) hence it is important to address all forms through a comprehensive approach. However, during emergencies the focus is often on preventing and treating undernutrition (wasting, stunting, micronutrient deficiencies and underweight) due to its impact on child morbidity and mortality. Children with severe acute malnutrition are nearly 12 times more likely to die than healthy children[1] Hence, saving lives and preventing deaths are the primary objectives of all emergency nutrition programs. In emergency situations, protecting optimal infant and young child feeding (IYCF) practices is also critical as mortality rates of artificially fed infants are elevated in comparison to breastfed babies[2]. This is because the risk of mortality due to diarrhea and other infectious diseases are 20 times higher in infants who are not exclusively breastfed compared to those who are exclusively breast fed[3]; due to prevalent unhygienic conditions coupled with lack of safe water and facilities to sterilize feeding bottles and prepare formula safely. Children who have been breast fed for longer periods of time tend to also exhibit lower odds of infectious morbidity and mortality[4],as infants who are not breast fed have sixfold greater risk of infections related in the first 2 months of life when compared with infants that have been adequately breast fed[5]. Therefore, supporting optimal breast feeding, re-lactation, and timely introduction of complementary foods, and continuation of breastfeeding up to 2 years should always be part of any emergency nutrition response.
Reducing malnutrition, its causes, and effects is important for achieving the Sustainable Development Goals (SDGs). Several scientific publications have indicated the importance of addressing and preventing malnutrition during the first 1000 days of a child’s life: from conception to the second birthday. If during this period the foundations for good nutrition are not properly established, irreversible damage will result such as stunting, and the child will not be able to grow to her or his full potential. It is estimated that scaling up of evidence-based nutrition specific intervention could reduce stunting by 20% and the prevalence of severe acute malnutrition by 50%[6]. Building on the 1000 days cycle, specific attention needs to be placed on supporting adolescent girls and women of reproductive age. Evidence exists of the positive effects of several specific nutrition interventions during that time period (e.g., exclusive breastfeeding during the first six months; introduction of complementary foods after 6 months, proper hygiene practices, deworming, fortification of salt with iodine). [7] even if they are scaled up to 90% coverage. Therefore, it’s important to make sectors such as food, agriculture, WASH, and health, nutrition sensitive and take a life cycle approach to prevent malnutrition at each stage of life and break the cross-generational cycle of malnutrition.
[1] UNICEF . The state of the worla’s children, 2019. Children, food, and nutrition. 2019.
[2] Davanzo R. Newborns in adverse conditions: issues, challenges, and interventions. J Midwifery Womens Health 2004;49:29–35.
[3] Maclaine A. Infant feeding in emergencies: experiences from Lebanon, 2007.
[4] Victora CG, Bahl R, Barros AJD, et al. Breastfeeding in the 21st century: epidemiology, mechanisms, and lifelong effect. Lancet 2016;387:475–90
[5] Davanzo R. Newborns in adverse conditions: issues, challenges, and interventions. J Midwifery Womens Health 2004;49:29–35.
[6] Bhutta ZA, Ahmed T, Black RE, Cousens S, Dewey K, Giugliani E, Haider BA, Kirkwood B, Morris SS, Sachdev H. What works? Interventions for maternal and child undernutrition and survival. Lancet. 2008;371(9610):417–40.
[7] Bhutta et al (2013) Evidence-based interventions for the improvement of maternal and child nutrition. What can be done and at what cost?. Lancet. 2013.

Nutrition High impact interventions include the following:
1. Promotion of exclusive breastfeeding in the first 6 months
2. Promotion of complementary feeding after 6 months
3. Promotion of improved hygiene practices
4. Vitamin A supplementation
5. Zinc supplementation for diarrhea management
6. Deworming for children
7. Iron‐folic acid supplementation for pregnant women
8. Iron fortification of staple foods
9. Salt iodization
10. Multiple Micronutrient Supplementation for under 5s
11. Prevention or treatment of moderate acute malnutrition
12. Prevention of treatment of severe acute malnutrition
Community based Management of Acute Malnutrition (CMAM)
The Community Management of Acute Malnutrition (CMAM) model is an approach designed to provide early detection and treatment of acute malnutrition in the community as well as support high coverage of cases as quickly as possible. It was first designed by Valid International through research they did between 2001-2005, which concluded that the CMAM model was the best approach for treating children with SAM in an emergency context as an alternative to traditional inpatient care. WHO and UNICEF later endorsed the community-based care of children with SAM in 2007, and there are as guidelines for treatment of children with SAM. However, there are currently, no WHO guideline for the management of moderate wasting, although children with moderate wasting are treated with ready to use supplementary foods (RUSF).
CMAM has four main components
- Community mobilization and engagement
- Targeted supplementary feeding program for the treatment of Moderate Acute Malnutrition (MAM).
- Outpatient therapeutic feeding program (OTP) for the treatment of Severe Acute Malnutrition (SAM).
- Inpatient treatment of SAM with
CMAM model is based on the principles of proving safe, effective therapeutic food for people to use at home; working with communities to help identify cases of malnutrition to encourage early detection; delivery of therapeutic food through existing structures reducing costs through integration of the treatment of malnutrition into health structures. The dramatic improvements in impact created by the CMAM model in combination with ready-to-use foods (RUFs) have led to a universal agreement that CMAM is now the preferred intervention approach for the treatment of malnutrition.
Determine the appropriate programme type/objective
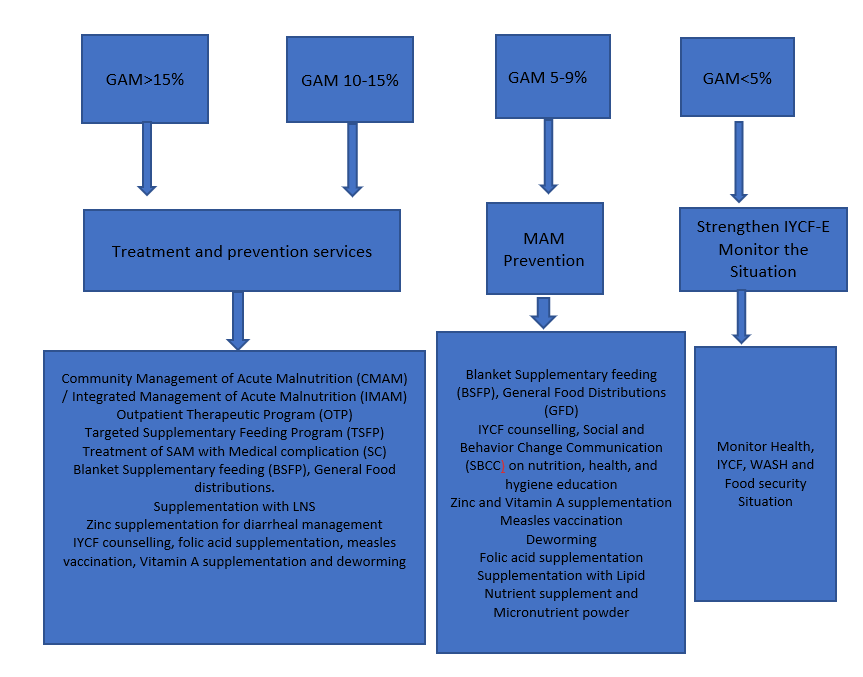
Depending on the context and the objective of a nutrition response there are four different end points or interventions:
- Prevention and Treatment: Global Acute Malnutrition (rates of 10-15%)
- Prevention alone (GAM =5-9%)
- Treatment alone (>15% GAM with limited resources)
- No additional intervention than strengthening IYCF-E and monitoring the situation (GAM= <5%)
The illustration shows you when to implement, in most emergencies combined nutrition treatment and prevention services are the right course to take (for more information refer to Annex 5.3).
Types of Nutrition programs and their Objectives
There are guidelines for selecting nutrition feeding programs to help identify the appropriate interventions, how to implement, monitor and evaluate their effectiveness. For more information on this please refer to Annex 5.7. The tables below will give you a brief overview of the main nutrition feeding programs during emergencies, their objectives, target population, when and how they are implemented.
|
Blanket Supplementary Feeding Program (BSFP) |
| Objective: The objective of the BSFP is to prevent acute malnutrition in young children aged 6-59 months and pregnant and lactating women in an emergency. It creates opportunities for community mobilization, community screening, referral for the management of SAM and MAM as well as for adding child survival interventions such as deworming, vitamin A supplementation, immunization and/or measles vaccination campaigns. |
| Target: Children aged 6-59 months and Pregnant women in their second trimester and lactating women with children aged 0-24 months with no malnutrition but at risk of developing it. |
| When: This is implemented when there is a high to serious level of acute malnutrition in the community (10-15% or above), coupled with high food insecurity, high prevalence of chronic malnutrition and micronutrient deficiencies. It is typically implemented during the lean or hunger season where food availability and access is limited. |
| How: Provision of Medium Quantity Lipid Nutrient supplement (MQ-LNS) called Pumpy Doz that for children aged 6-59 months and Plumpy mum for PLW to be given as one sachet per day. Small quantity Lipid nutrient Supplement (SQ-LNS) called Nutributter is also used for children aged 6-23months and Enov Mum for mothers. For both children and pregnant and lactating women CBS+ or ++ (Corn soya blend) can also be provided together with oil. The deciding factor between choosing CSB++ and LNS is the household’s ability to cook which is essential for provision of improved fortified blended foods such as Super Cereal Plus. Therefore, in the absence of cooking facilities or easy access to fuel or potable water, only ready-to-use foods are recommended for nutrition interventions in emergency settings |
| Duration: BSFP is a seasonal program that is implemented between 3-6 months depending on the severity of the emergency; during the lean seasons where food insecurity is high and malnutrition rates peak. |
|
Targeted Supplementary Feeding Program (TSFP) |
| Objective: To treat moderate acute malnutrition (MAM) in children aged 6-59 months and Pregnant, lactating women; reduce mortality risk associated with MAM; and provide follow up for children with Severe acute malnutrition (SAM) |
| Target: Children aged 6-59 months and PLWs with moderate acute malnutrition (MAM) |
| When: In non-emergencies GAM of at least 10 % or GAM of 5–9 % but with aggravating factors (Poor IYCF practices, chronic food insecurity, high childhood morbidity and poor access to health and WASH services). In Emergencies its implemented when GAM is 10-15% or above. |
| How: Specialized nutritious foods and blended fortified food are provided on a regular basis (Either biweekly or monthly depending on the modality). Normally children are provided 1 sachet of Ready to Use Supplementary food (RUSF) every day and PLWs receive a fixed ration amount of fortified blended CSB+ and oil. |
| Duration: The program continues if there is high GAM or low rate of GAM with aggravating factors. However, children and women are normally in the program for a maximum of 4 months before they get discharged as either recovered cases or non-respondents. In the case of non-respondents, they are re-admitted into the program as a re-admission case, with close follow up. |
| Outpatient Therapeutic Feeding Program (OTP) |
| Objective: To treat Severe acute malnutrition (SAM) in children aged 6-59 months and Pregnant, lactating women; reduce mortality risk associated with SAM; and provide referral to who deteriorate from MAM |
| Target: Children aged 6-59 months with Severe acute malnutrition (SAM) |
| When: GAM of at least 10 % or GAM of 5–9 % but with aggravating factors (Poor IYCF practices, chronic food insecurity, high childhood morbidity and poor access to health and WASH services). |
| How: Through the provision of Specialized nutritious foods (Ready to Use Therapeutic food (RUTF) every day given on a weekly basis. |
| Duration: The program continues if there is high GAM or low rate of GAM with aggravating factors. However, children can be in the program for a maximum of 4 months before they get discharged as either recovered cases or non-respondents. |
|
Stabilization Center Support (SC) |
| Objective: To treat complicated severe acute malnutrition (SAM) in children aged 0-59 months to stabilize medical complications and appetite and provide referral back to OTP. |
| Target: Children aged 0-59 months with complicated severe acute malnutrition (SAM) |
| When: In non-emergencies GAM of at least 10 % or GAM of 5–9 % but with aggravating factors (Poor IYCF practices, chronic food insecurity, high childhood morbidity and poor access to health and WASH services). In Emergencies its implemented when GAM is 10-15% or above. |
| How: Through the provision of inpatient care and Specialized Formula milk given orally or intravenously every day given, in addition to medication. |
| Duration: The program continues if there is high GAM or low rate of GAM with aggravating factors. The stabilization center is only to stabilize children with medical complications with poor appetite and length of stay depends on the recovery of the child. Once medical complications are resolved, and appetite is regained, the child must be discharged to continue the rest of his/her treatment for SAM in the OTP in an outpatient setting. |
A good nutrition response should strengthen and create links between community and authorities in relation to mobilization, information sharing, and referrals. Very often programs forget to create links between community health workers, local authorities, and health center (HC) staff. It is very important that a clear and effective referral pathway is established between the different CMAM program components (OTP, TSFP, SC, IYCF). Community engagement in screening, nutrition promotions and IYCF counselling activities is paramount to the success of the nutrition program. Make sure you have specific activities on engaging local authorities and communities in program design, delivery, and feedback.
Determine the delivery mechanism: Several factors are important to consider when planning the delivery of a prevention of acute malnutrition programs, such as access to the population, scale of the emergency (including total area affected, etc.), implementation capacity and population density. For instance, population density is an important consideration when determining the number of treatment or delivery sites to ensure access to the sites as well as reducing the time spent to reach the site and for waiting at the site. In densely populated areas, it may be necessary to have multiple days a week for program delivery. They may be integrated with other distribution platforms or other services depending on the situation.
Articulate well the exit strategy: If the program plans to hire specific staff to support the Ministry of Health (MOH) staff to deal with heavy caseload, ensure you have an exit strategy, hand over plan and capacity-building activities right from the beginning of the program and include the associated cost for handing over of the services. Activities should be decentralized as much as possible with a lot of community engagement, this way the chances of activities continuing past project period is likely with the support of local authorities and MOH.
Ensure continuum of care: SAM treatment should be followed by a period of continued support, through MAM treatment programming. Planning of SAM and MAM treatment should be done in a way that promotes a continuum of care for acute malnutrition. Ideally sites should be co-located or as close as possible to each other, with 30 min of walk. When planning a CMAM program ensure you are planning to address both SAM and MAM as it is more difficult to coordinate with other agencies in an emergency context and to avoid the risk of children falling between cracks. It is also important to map whether stabilization center support is available in area where there is SAM and MAM programs, to ensure children with complicated SAM are effectively referred to stabilization centers (SC) in the hospitals as they require inpatient care. If the SC is non-functional, then consider supporting it to make the referral more effective. This can be done through the provision of food for caregivers and children, cooking facilities, nutrition supplies, capacity building of staff and transportation costs or vehicles.
Strengthen the prevention of Malnutrition: Make sure your program also includes activities for the prevention of acute malnutrition such as Social and Behavior Change Communication (SBCC) on infant and young child feeding practices, nutrition, health, hygiene education, micronutrient supplementation, deworming, Vitamin A supplementation, measles vaccination, and provision of Lipid based nutrient supplements. Link with other services addressing immediate and underlying causes of malnutrition (Liaise with CARE WASH, Health, Food Security teams to co-locate services to maximize the impact of the response.)
Ensure effectiveness of the Nutrition programs by:
- Delivering services at scale (broad geographical area)
- Delivering high impact interventions in highly vulnerable areas**
- Providing frequent meaningful interpersonal contacts with mothers, caregivers, and family members.
- Use all forms of Social and Behavior Change Communication (SBCC) for IYCF messaging and use consistent and harmonized messages through Interpersonal communication, social mobilization, and mass media.
- Address both nutrition-specific and nutrition-sensitive determinants of malnutrition.
- Be data driven, include measures of quality, process, outputs, and outcome.
- Continued monitoring of high-level indicators generally collected through the Demographic and Health Surveys or large-scale population-based surveys (SMART, SQUEC, IYCF) Increase impact and cost‐effectiveness by better integration across multiple sectors.
- Ensure integration of disaster and emergency preparedness into the program cycle in order to respond effectively, quickly and protect the nutritional status of the population, particularly the most vulnerable.
- Provide capacity-building and essential supplies for health workers for screening of malnourished children and treatment of moderate and severe cases at health facilities.
- Integrate nutrition treatment programs into existing health infrastructure and provide integrated services.
Nutrition-Sensitive Programming
Apart from direct nutrition interventions to tackle malnutrition, there is also growing recognition that nutrition sensitive programming can reduce the impact of malnutrition and strengthen resilience in the long term. The evidence of the use of Cash and Voucher assistance (CVA) for nutrition outcomes is growing and it has shown that CVA can improve nutritional outcomes by impacting on the underlying determinants of adequate nutrition This can occur through three main pathways:
- Access to CVA can improve access to food, health, water, medication, and transportation to feeding centers.
- Cash recipients receive social, and behavior change communication (SBCC) on optimal infant and child feeding and the importance of a balanced diet, which can in turn improve their household dietary diversity.
- Empowering women in their access and control over dietary decisions can facilitate better and informed decisions over what they want to eat without thinking of the economic pressures. Furthermore, the increase in household income associated with CVA can in turn increase the time available for practicing important infant and young child feeding practices such as exclusive breastfeeding, appropriate complementary feeding, and continuation of breastfeeding up to 2 years.
By using the conceptual framework of malnutrition, we can understand how CVA can be used to improve nutritional outcomes. The below table helps you to understand the different barriers at each of the underlying determinants to adequate nutrition and highlights how CVA can be used to address these gaps or barriers. It highlights common barriers on the demand and supply side with those in yellow considered ‘economic barriers’ and can be addressed by enhancing additional purchasing power, e.g., CVA. Economic barriers are all on the demand side. They include both financial barriers related to the lack of financial resources at the household level to access goods and services as well as opportunity costs. This can guide you to identify which gaps/barriers (demand or supply) your project will be addressing and how to use CVA for it. Therefore, it’s important to understand these gaps in initial need assessment to determine and justify the need for CVA for improving nutrition outcomes in your respective programming (for more information refer to Annex 5.8).
Tips for writing Emergency Nutrition proposals
In order to write a successful nutrition proposal, you need to document a strong needs analysis and the prevalence of GAM in the affected area should always be referenced as it’s a key indicator of vulnerability. For the decision-making purposes a GAM prevalence (wasting) is generally considered critical when prevalence is above 15%, serious when between 10 -15% and low when it is < 5-9 % and acceptable when it’s <5%, however these WHO thresholds have recently been revised (see classifying malnutrition section). Understanding the seasonality of GAM in the emergency affected population is also critical in classifying the GAM prevalence. If there is a lack of data on GAM prevalence or a recent SMART survey done in the area (within the last 3-6 months), then you can do the following:
- Review outdated GAM prevalence alongside contributing factors during that same period and make assumption about whether the situation is still the same or much worse.
- Review recent data on contributing factors (e.g., infant, and young child feeding practices, dietary intake, morbidity, access to health and WASH services, household food security, feeding and care practices, poverty etc.) and assess whether similar trends from the outdated GAM may still apply.
- Review performance data from programs and routine systems (i.e., CMAM data, IYCF counselling and sessions, screening data, growth monitoring, immunization, micronutrient supplementation, social protection, etc.) and compare to previous years to identify any changes in trends of changes on nutrition outcome data other than seasonal changes.
GAM prevalence can also be corroborated by the number of children with MAM and SAM in treatment if we have a clear understanding of the coverage and therefore the current met need. When there is no recent SMART data, screening data or program admission data then as a final call for the decision-making process information on risk of deterioration may be used.
How do you evaluate the risk of Deterioration in an area?
Since wasting is an outcome of poor health or care and inadequate dietary intake, childhood morbidity and food insecurity information on these factors in the need assessments or situational analysis of a proposal can help infer the risk of wasting amongst a population.
- Increased childhood morbidity: Increase in incidence of diarrhea, acute respiratory infection, malaria, and measles in non-immune populations are common childhood in emergencies. Certain types of emergencies (flooding, earthquake) and settings (urban, IDPs camps) are more likely to cause an increased risk of morbidity. The population’s access to water (quantity and quality), sanitation and hygiene services and crowding is also an important component in determining morbidity risks. Thus, collecting information of vaccination coverage, supplementation including Vitamin A, and common childhood morbidity in an area can help infer the risk of wasting amongst children under 5.
- Decreased food security (disrupted food availability, access, or utilization): Conflicts, drought, flooding and earthquakes have major impact on food security especially on the availability and access to food. During emergencies markets are often disrupted, damaged and there is a loss of livelihood negatively impacting on household income. Increased food prices also have a significant impact on the prevalence of acute malnutrition in an area. Hence you should collect available data on household food security, consumption and market information and household coping strategies. Negative coping strategies such as skipping meals or reducing intake will have direct impact on GAM. The likely deterioration of the food security situation in an area, including the proportion of households that are likely to be moderately or severely food insecure, should also be highlighted in the light of the increasing incidence of malnutrition.
- Infant and young child feeding practices in Emergencies (IYCF-E): Infant and young child feeding practices are often negatively affected during emergencies, and this can result in an increase in malnutrition in young children. Babies 6-23 months are the most affected since this is when complementary foods are introduced, and children’s diets begin to diversify to meet their growth requirements. Emergencies can set back this important milestone if diets are inadequate and available food is unsanitary or unsafe, exposing children to pathogens that cause illness. Mothers may be affected by multiple stresses and unable to breastfeed sufficiently or care for their infants optimally. Therefore, it is important to address IYCF-E as part of the prevention of acute malnutrition and treatment of SAM and MAM interventions, particularly to emphasize exclusive and continued breastfeeding and optimal complementary feeding in children 6-23 months of age. Therefore, try to include the prevalence rates of these different indicators either from a recent IYCF KAP survey conducted in the area or use the data captured from national demographic surveys in order to better assess the risk of malnutrition in the area. In an emergency stress, lack of food, limited privacy, and uncontrolled distribution of breast milk substitutes (BMS) are among the challenges that can undermine infant feeding practices. Because the interruption of breastfeeding can lead to the rapid deterioration of an infant’s health and lead to malnutrition, it is important that there is professional support and counselling at different contact points within the nutrition program.
- Significant population displacement: Population displacement is another which may influence malnutrition as people lose their livelihoods and their income. As a rule of thumb if the displacement is increasing consider the risk of malnutrition to be high (due to limited basic services, overcrowding, unhygienic conditions etc); and if there is no displacement or no increase in displacement or the population are sparsely spread consider the risk to be low.
- Population density can also influence the risk of illness/disease outbreak especially in overcrowded places. In addition to this there are also circumstances where despite a low prevalence of GAM there will be many children in need of services due to the high population density; thus, leading to high caseload. Therefore, despite the low GAM prevalence information of number of expected cases in an area is also an important determinant for the need of an intervention and choosing service delivery.
For further guidance and tips on writing BHA specific nutrition concept notes and proposals see Annex 5.9 and 5.10.
Monitoring and Evaluating Emergency Nutrition programs
Monitoring is the ongoing collection, analysis, and interpretation of program data, this includes monitoring activities (inputs), services (outputs) and outcomes (Results). The primary purpose of monitoring data is to assess one’s performance and for program improvement. The aim of monitoring is that the data reported should be reviewed, acted upon on an ongoing basis to inform program implementation (to modify it as per the need). Without a monitoring system in place, you cannot track or demonstrate the results of the program. If monitoring is done properly, it will also allow for trend analysis and cross comparison between different times, seasons, and geographic space.
Evaluation is a process of data collection designed to assess the effectiveness of the project in attaining its originally stated objectives and the extent to which observed changes are attributable to the project. It’s often done at the end of the project but could be planned at strategic periods during the project life span. It can use rigorous study designs e.g., experimental design or quasi-experimental-involving control groups.
Both Monitoring and Evaluation need clear stated goals and objectives and usually have four components: Inputs, processes, outputs, and outcomes. Inputs are the set of resources dedicated to a Program including human and financial resources, physical facilities, equipment, and operational policies that enable services to be delivered (i.e., staff, facility, equipment’s, storage rooms, supplies etc.). Process refers to the set of activities which are carried out to achieve the objectives of the project such as procurement and distribution of ready to use food rations, community mobilization, screening conducting IYCF and CMAM trainings etc. Outputs are the results obtained because of the execution of activities such as number of children who received treatment for acute malnutrition, numbers of staff performing better as a result of training, number of people having access and using nutrition services, number of functional and operating nutrition centers after support etc. Outcome is the set of results expected to occur at the population level due to Program activities and generation of Program outputs. The intermediate outcomes often result directly from project outputs such as reduced number of children with SAM (due to increased access to treatment services). The long-term outcome often comes as result of the actions of the intermediate outcomes such as drop in prevalence of malnutrition in the area over time, reduced child mortality, morbidity, and better health.
The M&E plan
The purpose of the M&E Plan is to serve as a framework for activities to demonstrate accountability and improve the quality of activity implementation and outcomes for participants. The M&E Plan should serve as a roadmap for activity staff, documenting M&E approaches and processes in sufficient detail. It should demonstrate that you have a rigorous system for monitoring and evaluating activity performance in a way that produces accurate, reliable, and useful data in a timely manner for decision making’.
Components of a M&E Framework and Plan
To develop a Monitoring and Evaluation framework you need to determine your objectives and what nutrition intervention you want to implement. Based on this you decide what is to be monitored and evaluated (The activities); who will be responsible for monitoring and evaluation of the activities, the resources you will need, when monitoring and evaluation activities are planned; and how they will be carried out. You can follow these steps.
- Determine indicators for monitoring and reporting of nutrition programs based on requirements outlined in the nutrition proposal (objectives) or response plan. The indicators must include those specified in the project proposal and you must be able to describe them and how they are computed in the M&E plan. It’s important to disaggregate indicators into sex and age groups especially as most donors have specific requirements for this type of disaggregation. The indicators selected must provide evidence that defines the extent to which project interventions are successful in achieving the set objectives. Make sure that the specific purpose of indicators to be collected is relevant for decision-making and avoid collecting data, indicators and information that will not be used or is already being collected by other sectors.
- Determine the data collection methods – Map out if you will be using a digital platform or manual registration systems and consider existing capacities such as internet connectivity, training level of people collecting the data etc. Following that map out the resources you need to build the capacity of relevant personnel to collect this data using agreed methods and consolidated tools for cross comparison over space (geography) and time. Any disaggregation (e.g., by age, gender, economic status/income, or geographic location) should be factored into tools of data collection to enable the system to capture these.
- Determine who will be responsible for the data collection – this is the person who will collect the primary data and who is responsible for checking its accurately recorded and captured in the data collection tool (registers, books etc.)
- Determine the frequency of data collection – this can be based on the normal time of service delivery, for example the time of OTP service delivery (weekly) or based on when it’s feasible to collect it. For example, since recovery can take time, collecting this data from registration books on a monthly basis is recommended to get a meaningful analysis.
- Determine the Means of verification of the data (the source of the data) – This is where the data is stored, the primary source of it. This can be things such as training reports, OTP registers or cards, IYCF KAP survey report or counselling reports etc.
You can also incorporate into the M&E framework a workplan of when activities are supposed to be conducted, a baseline, a target and milestone (i.e., mid and end projects) for each indicator, this is especially useful if some of the indicators are captured through assessments such as SMART or KAP surveys.
Source of Nutrition information
Nutrition programs draw data and information from direct sources as well as from other information systems. The main nutrition data and information sources include:
- Routine data collected through the nutrition program or the health information systems. This includes data on how many children were screened, how many were admitted to programs, their outcomes, data on supplementation and training etc.,
- Population based data includes large scale surveys such as National Demographic and Health Survey, Multiple Indicator Cluster Survey (MICS), nutrition SMART surveys, Maternal Infant and Young Child Nutrition (MIYCN) KAP assessments, CMAM program coverage surveys among others.
- Early Warning System – These can include joint Food Security and Nutrition Seasonal Assessments including situation analysis with Integrated Phase Classification for acute malnutrition and food Insecurity (IPC AMN and AFI) protocols, Mass screening data, Special studies, and operational research.
Evaluation of Emergency Nutrition Programs
An evaluation process demands formulating the objectives against which the program is going to be evaluated. For instance, from an implementation agency perspective the question could be, is the program performing as expected? and from a donor’s perspective the question could be ‘is the program worth continuing or extending’? Therefore, the question “How do we tell if a program has an effect?” is incomplete without knowing why one needs to know. Common reasons for doing an evaluation are to decide whether to continue the existing program or not, to redesign the program if necessary, or to decide whether to do similar program elsewhere. Whether you do this evaluation internally or externally there are a few important evaluation criteria you must consider including relevance, effectiveness, efficiency, coverage, quality of services and impact. Since most evaluations tend to be done by external partners you must ensure you are meeting all the evaluation criteria and design your nutrition intervention in such a way that is aligned to these criteria.
RELEVANCE/APPROPRIATENESS – A national nutrition strategy and strong government commitment supporting the relevance and sustainability of CMAM programming is essential. You must show how the specific nutrition interventions are in line with the national nutrition strategy and how they have contributed to strengthening the strategic coordination of the government to reach the most vulnerable. This means the program should be implemented in areas where the need is greatest as identified by the Ministry of health or the nutrition cluster. It is important that you show how you contributed to national capacity-building of health professionals and community workers, to policy and system development and to the engagement of other key stakeholders.
EFFICIENCY – Many of the ways of maximizing the efficiency of a nutrition program include:
- Prepositioning of stock is cost effective in the sense that if you buy RUTF in bulk this will serve as buffer stock. In case of an emergency or a scale up it will save both freight cost and time as it takes on average 2-3 months to procure RUTF internationally. If the supply chain is not reliable there will be interruptions in treatment protocol and affect the quality of program implementation. Hence for the programs to be efficient there is a need to preposition supplies, and ensure stock availability by keeping contingency stock
- Use of Existing infrastructure and resources: As economy is related to how to minimize the costs of inputs to reach desirable outputs. One shining example of this is the community-based nutrition program that uses existing health service platforms to deliver nutrition specific interventions. The utilization of health care staff and community volunteers to carry out these services is much cheaper than employing staff or setting up nutrition centers. Hence you should ensure nutrition is well integrated with Health and CMAM is delivered through the health service delivery points. The health care staff normally require training only and the use of health community volunteers is free. Hence transforming CMAM into a permanent and regular program integrated with the national health system is the most sustainable option country-wise.
- Cost per beneficiary is also important to look at. Treatment of severe acute malnutrition is generally an expensive program which on average globally costs $200 USD/child. This cost varies from country to country but can be reduced if Ready to use Therapeutic foods (RUTF) are sourced locally in countries producing a high quality RUTF. Projects with smaller beneficiary caseload and high activity cost are not good value for money. Ideally the implementing partner should have a high beneficiary number with lower costs; however, cost per beneficiary can rise in the case of refugee camps which have higher costs due to infrastructure costs (clinics). National NGOs may also have lower beneficiary costs due to the lower human resource costs than international NGOs. The cost per beneficiary can be calculated by dividing the total beneficiaries under a CMAM component with the cost of the activity. Child health days for the delivery of essential nutrition intervention such as Vitamin A supplementation, deworming can rapidly enhance coverage much more than standalone campaigns, hence its more efficient use of resources.
- Efficient use of Ready to use therapeutic and Supplementary Food (RUTF, RUSF) is also an essential part of efficient use or resources. If RUTF/RUSF is misused, sold, or shared with other household members, then the child will not gain weight and the length of stay in the CMAM program will be longer. This will also increase re-admission rates; hence for the efficient use of RUTF/RUSF, monitoring and educating caregivers is important to improve program quality.
- The short-term stop-start gap funding arrangement of nutrition programs is not likely to yield substantial reduction in GAM unless a multi-sectoral long-term strategy is developed and implemented. A more preventive approach (nutrition sensitive programs) and longer-term financing (multi-year) is likely to save emergency funds, strengthen the national health system, and improve nutritional status in the country. Country offices should be able to pass on the benefits of multi-year financing to their implementing partners. Drawing a line between emergency and development funding is not conducive to bridging the gaps and ensuring sustainability.
EFFECTIVENESS – Community based Management of Acute Malnutrition (CMAM) is one of the 13 highly cost-effective direct nutrition interventions identified in the scaling up nutrition framework for action. Supporting community-based interventions increases cost-effectiveness, coverage, program quality and equity. The desired outcome of a CMAM program is often to reduce GAM rate and this can be assessed through the cost of percentage reduction in SAM and MAM prevalence. The impact of the number of lives saved can be assessed through the cost of child malnutrition deaths averted or Disability-adjusted life years (DALYs) averted. Both are examples of cost-effectiveness analysis. However, to do this the benefits must be monetized, and this might be difficult to do for in an emergency setting due to lack of data, unclear causality, lack of access, etc. Hence a qualitative assessment needs to be carried out to provide a picture of effectiveness of projects and response. Obtaining beneficiary feedback and opinions of the response is one crucial component of value for money (VfM) measurement of effectiveness. Misperceptions by the community may pose sizeable constraints to the effectiveness of a CMAM program through shyness of community members to use CMAM services, therefore community assessments and sensitization prior to program implementation are critical.
The timing of the response or relief is an important measure of cost-effectiveness. Nutrition programs can be delayed by bureaucratic procedures which delay the contracting and release of funding to the implementing partner. Consider MOU drafting or agreements early on during the project planning phase when working with government or local partners. One of the other things to consider is whether the arrival of any nutrition supplies is timely. Cost savings aspects in a CMAM program includes procuring supplies when the international market price is low, the use of health care workers and community volunteers for implementation of activities, conducting assessment using local expertise and staff and minimizing the cost of international consultancies, prepositioning of stock in case of a scale up following onset of emergency.
COVERAGE – In nutrition program treatment coverage is an important aspect of effectiveness. It is important to measure if all children with acute malnutrition are accessing the services available. The sphere standard of coverage for CMAM program 50% for rural areas; 70% for host communities and 90% in refugee or camp settings. This can be measured by conducting a coverage survey. Such a survey will enable you to understand the barriers to service uptake and appropriate action can then be taken to improve the treatment coverage. An example of poor coverage could be misperceptions by the community, and this may pose sizeable constraints to the effectiveness of a CMAM program; therefore, community assessments and sensitization prior to program implementation and during are critical to maximize program uptake. If full coverage survey cannot be conducted, the % of the expected total reach of the program is a good indication of effectiveness. Low reach (below the milestone) is an indication that the program is not reaching all the children with acute malnutrition needing the service.
QUALITY – One way to check the quality of the nutrition services delivered is to monitor their performance outcome indicators. These are then compared to the Sphere standards which are:
- Recovery: >75%
- Death: 3-10%
- Defaulter: <15%
These performance indicators must be consistently collected across sites and the reporting rate must be satisfactory (above 80%) otherwise it will be difficult to assess the effectiveness of the program. You should indicate how capacity needs assessments have been undertaken for efficient use of resources and well-targeted training; capacity development activities should be followed up to improve the quality of service and skills. You can mention how you have identified the need for the training delivered and the subsequent follow-up to ensure the skills have been transferred. Wider benefits of the program need to be described, for example how the treatment of malnutrition has long-term benefits for not only the household but also the community and society.
Good beneficiary feedback is also a sign of an effective response; nutrition program with strong community participation in its design, implementation and evaluation phase is more likely to be effective. You should therefore report on the beneficiary feedback and how the program capitalized on community participation.
IMPACT – To show the impact of a nutrition program or intervention in an area you must be able to demonstrate any positive changes in nutritional status, growth, or diet and this must be compared to some baseline line study. For example, the nutritional status of children before the program started versus nutritional status post intervention is one way to demonstrate this however you must consider seasonality into your assessment (both assessments must be done within the same seasons). Any changes during the project period are worth noting such as any improvement in dietary diversity, exclusive breastfeeding rate, improved uptake of health services and attendance because of nutrition education and counselling. Where possible, it is highly recommended that program anthropometric data collected on the beneficiaries are complemented by cross-sectional surveys in the target population (including participants and non-participants) and in similar populations not participating in the program (control or comparison group). Ideally, cross-sectional surveys such as a SMART and IYCF KAP, including at least one during the time before the initiation of the program (baseline), should be carried out on a regular basis. Because the logistic problems involved in measuring the same individual through time are not practical, therefore the longitudinal approach is not recommended.